Dowding spent considerable resources developing RDF and building the Chain Home network. As the number of stations increased, the volume of information they produced became overwhelming. During practical exercises conducted before the war, the volume of data coming from the RDF stations paralyzed his defense network. When they were able to act on the information, they found it to be inaccurate or redundant. His complex organization was failing.
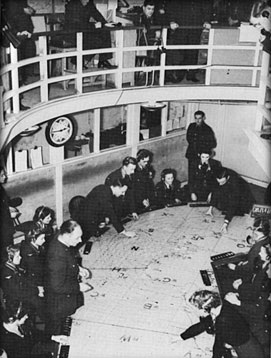
The Filter Room at Bentley Priory
These exercises showed Dowding that the RDF information had to be parsed before it would be useful. So his scientists devised a system to filter all incoming information into a usable raid picture. A clear, accurate depiction of incoming aircraft.
The key to this system was the Filter Room, a centralized location at Dowding’s headquarters in Bentley Priory. The Filter Room was a converted ballroom in the basement of the mansion. Inside was a massive map table displaying the coasts and approaches to the British Isles. Men and women were crowded around the table, connected via headphones to the RDF stations on the coast.
The map table was the focal point of the Filter Room.
Filter Room Map
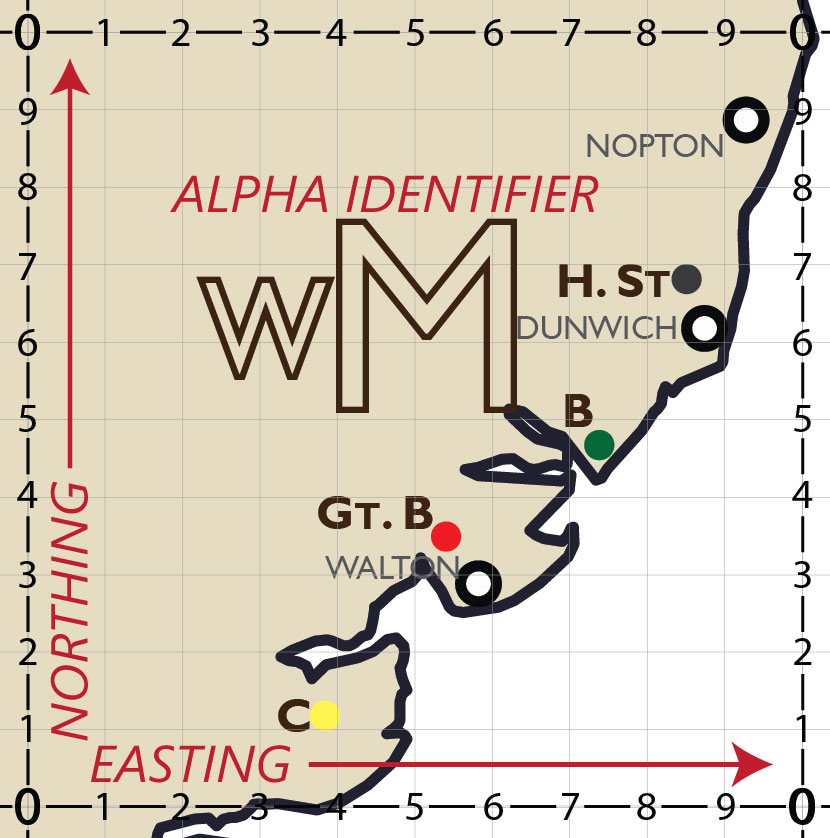
The British Modified Grid used on all maps in the Dowding System
The map table only displayed information relevant to identifying radar returns. Because the primary resource was RDF stations from the Chain Home and Chain Home Low stations, their locations and names were prominent. A series of arcs radiated from each Chain Home station. These arcs extended from the station marker at an interval of 10 miles and covering a sweep of 180 degrees. This reflected the beam pattern of the RDF station. The map assigned each station and its corresponding arcs a different color.
British Modified Grid
The map table, like all map tables was divided into a coordinate scheme called the British Modified Grid. This system was common throughout all maps in the Dowding System.
It divided the country into 100 km squares, each assigned a 2 digit alpha identifier. These squares were each further subdivided into 10 km squares.
Locations on the grid were described by the Alpha Identifier and a four digit code. To plot the coordinates they located the correct 100 km square, identified by the 2 digit Alpha Identifier. Inside this square, they followed a procedure called “Easting and Northing.” Starting at the origin point in the lower left corner of the 100 km square, they located the first two digits by travelling to the right (east). Once determined, they located the next two digits by travelling up (north). The intersection of these points was the correct position. This system allowed all personnel to prevent errors while passing information.
Roles in the Filter Room
The Filter Room was a cramped, noisy place. During a German Raid, the room bustled with a chaotic energy. But despite its appearance, everyone in the room was well organized into roles.
Filter Plotters
Filter Plotters were stationed around the map table, each connected via a headset telephone to an RDF station. Each Plotter was in constant and direct contact with their station. RDF Operators in the receiving hut reported information to the Plotter in real time. The Plotter would place markers in the corresponding area on the map to display the information. This was a complex process, with different tokens used to denote different information.
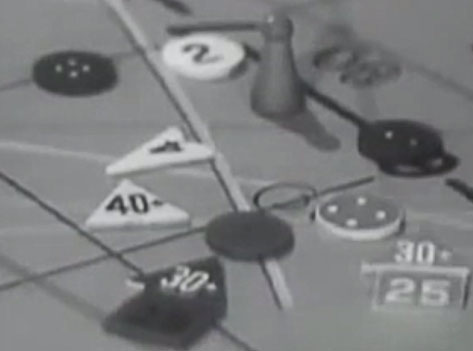
The various tokens used in the Filter Room
- Plotters used circles to indicate position. They would place the marker at the location on the map relayed from the RDF Operator. One side of the token was marked with a numeral, used when the reading came from a CH station. The other side had an equal number of dots, used when a reading came from CHL.
- Triangle tokens indicated the estimated number of aircraft.
- Square tokens indicated the estimated height of the aircraft.
Filter Plotters plotted not only the coordinates from the RDF Operator, but also information about height and number. They had to select and place the appropriate shape and number tokens before they received the next plot. Due to the rapid speed of incoming aircraft, it was critical for the Plotter to process the information correctly on the first attempt.
The Plotter also ensured that the information displayed was no more than 2.5 minutes old. To ensure this an electronic clock displayed the numbers 1-5 in sequence. The illuminated number indicated which circular tokens to use For example if the clock indicated 3, the Plotter would use the circle tokens with a 3 marking. As the time indicator cycled through a number a second time, Plotters recycled the old tokens.
Filterers
As Plotters filled the table with independent markers, the Filterer turned them into a coherent picture. They had to make four critical decisions about the information that was displayed. And they had to do this fast. They were expected to filter the information in less than two minutes. Every minute a they delayed a decision to confirm information was 4 miles and 2,800 feet of altitude lost to the defending pilots. But poor decisions might result in a missed interception.
Range Cutting
Their first task was to triangulate the location plots into a corrected position. Because the bearings from RDF stations were inaccurate, the Filterer could not rely on the location plot from a single station. They had to use multiple stations to “triangulate” the correct location. The Filterer looked for tokens with the same time marking (1-5). This indicated that stations were reading the same aircraft at the same time. Because range was more accurate, the Filterer would determine the distance using the RADAR arcs on the map. The Filterer would follow the arcs for each plot until they intersected. This was the corrected position. The Filterer would place a small plastic token called a halma in this position. This procedure, called “range cutting,” used multiple data sources to minimize inherent inaccuracies.
The next decision was about the number of aircraft in the raid. Due to RDFs technical limitations, this was also inaccurate and often conflicting information. For example, an RDF station facing a raid may only “see” the echo of the front wave and under report the number of aircraft. An RDF station located to the side of a raid may return a more accurate estimate, being able to “see” the whole raid. This was a critical decision for the Filterer. Is the number was under-reported, the RAF fighters may be overwhelmed by superior numbers. On 24 July, a raid was reported as nine aircraft. The fighters scrambled to intercept it found themselves facing over 80 German aircraft. A serious mistake that endangered pilots and aircraft.
If the raid was over-reported, precious resources may be wasted. Filterers had to quickly determine the probable course of the incoming aircraft and assess their location relative to the reporting RDF stations. Because counting aircraft using RDF was a highly subjective measurement, the Filterer also had to take into account the experience and reliability of the reporting station’s RDF Operator.
Altitude estimation required complex calculations and was still subject to several variables. When deciding between two differing reported values, it might seem advisable to simply calculate the average. But this would endanger pilots; in a dogfight, altitude is advantage. Filterers had to quickly determine which RDF station was reporting altitude most accurately.
Finally, the Filterers had to determine the course of the incoming planes. Which direction the were heading in. As they were making the critical decisions on location, number, and altiude, the Plotters were continuing to receive and plot updated information. As soon as the second location tokens were plotted, the Filter would have enough information to determine the course. They placed an arrow-shaped marker on the table to indicate this. The point of the arrow indicated the corrected location of the raid, and the shape indicated the course.
Once the arrow was placed, the raid was confirmed in the Dowding System. From this point on it was communicated throughout the system. As new information came in, the Filterer continued to build and refine the raid. This raid information was displayed on a thin metal strip, called a raid plaque, that was placed at the head of the arrow.
Controller
The Controller sat on a dais above the Filter Room Map table and oversaw the operations of the entire group. The Controller worked with the Liaison Section. Their job was to ensure that flights from Coastal Command, Bomber Command, and other services were not identified as hostile. The Controller also ensured that personnel were following the complex time management system.
Teller
Three Tellers stood on a dais overlooking the map table. They watched the table and communicated confirmed raids, indicated by the arrow token. The Teller spoke into a headset telephone that was connected directly to the Bentley Priory Headquarters Operations Room, Group Operation Rooms, and Sector Operations Rooms. All Tellers followed a standard format for passing information, using the RAF Phonetic Alphabet to provide clarity:
Raid Number, Alpha Identifier plus Grid Reference, Direction, Number of Aircraft, Estimated Altitude
Ex. “New raid appearing, Hostile 26, Willie Victor fife niner, zero two (WV 5902), North West, twenty-five aircraft at eighteen thousand feet.”